Exclusive Deals & Trending Items
Gold prices in India change due to global and local factors. India is the world’s biggest gold consumer, holding over 2,000 tons of unused gold. This makes its market very sensitive to economic changes.
Many things affect gold prices, like inflation rates and festivals like Diwali. These changes impact both buyers and investors.
The Reserve Bank of India’s gold reserves and USD-INR exchange rates also play a part. Bajaj Finance offers gold loans up to Rs. 2 crore to 80.41 million customers. This shows gold’s value as both an asset and a cultural symbol.
Key Takeaways
- India’s status as the top global gold consumer drives unique gold market trends.
- Inflation directly impacts prices, making gold a hedge during economic uncertainty.
- Seasonal spikes, like Diwali purchases, can push prices up by tons of demand.
- Bajaj Finance’s gold loans and RBI policies influence affordability and market stability.
- Exchange rates and global supply chains, including COMEX and London Bullion Market data, affect daily rates.
The Significance of Gold in Indian Culture and Economy
Gold is more than just a metal in India. It’s deeply rooted in traditions and economic decisions. With 25% of global consumption, it holds a special place. It’s seen in weddings and temple offerings, showing its importance.
Families treasure gold jewelry, passing it down through generations. Over 60% see it as a symbol of status and history. This tradition is strong and enduring.
- Wedding rituals often include gold gifts, with brides receiving heirlooms.
- Temples like Tirumala’s annual gold donations highlight its spiritual value.
- Over 70% of households own gold, making it a common savings choice.
Economically, gold impacts India’s trade balance. High demand raises import bills, affecting the current account deficit. Factors affecting gold prices, like global supply and inflation, play a big role. The Reserve Bank of India watches these gold market trends closely.
They adjust policies to control inflation or stabilize reserves. This shows gold’s influence on the economy.
“Gold’s value grows with time, making it a timeless investment.”
Psychology also plays a part. Even with rising prices, demand remains strong. Over 80% view gold as a hedge against inflation, preferring it over stocks.
Price changes, driven by global policies and regional demand, shape gold market trends. Changes in US interest rates or geopolitical shifts can affect local prices. This impacts jewellers and investors.
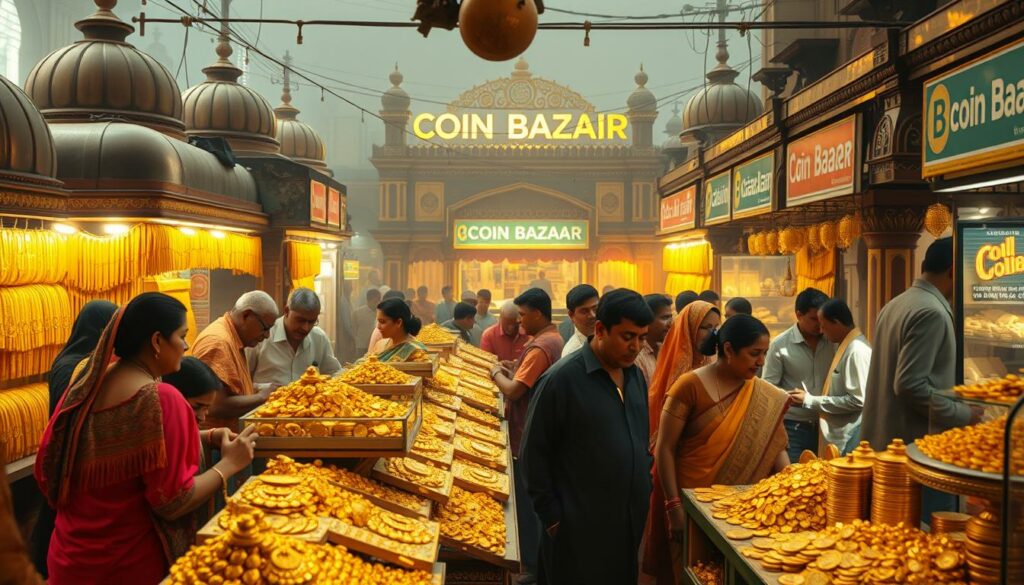

Understanding gold’s cultural and economic significance helps us grasp factors affecting gold prices. Whether for a wedding or investment, gold’s role in tradition and finance is vital in India.
Historical Patterns in Indian Gold Prices
Gold prices in India have changed a lot since 1964. They went from ₹63.25 per 10 grams to ₹79,200 in 2025. Historical gold price data shows trends, and gold price analysis helps us make smart choices. Let’s explore these trends together.
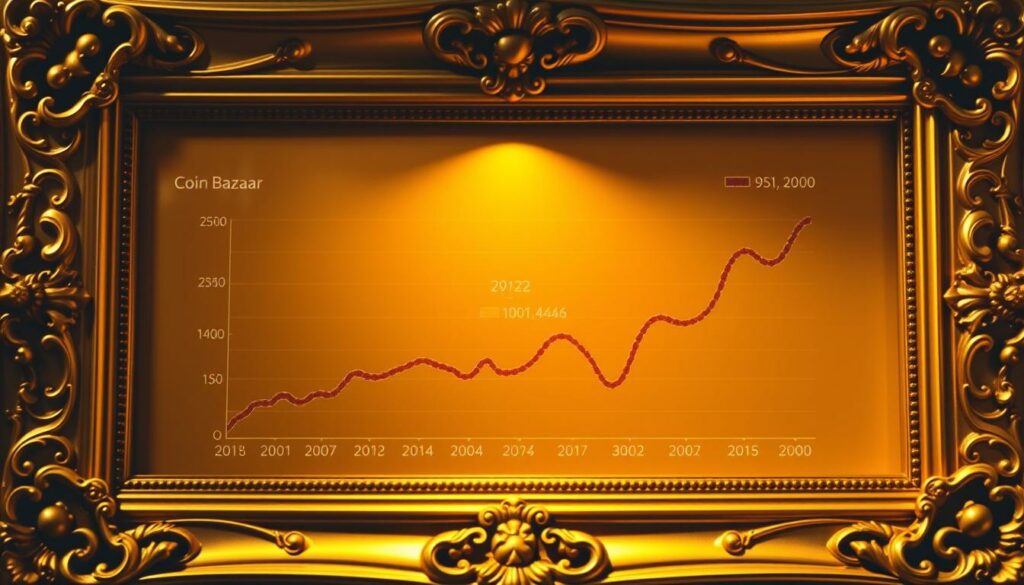

Key Milestones in India’s Gold Market History
There have been big changes in gold prices over the years. Here are some key moments:
- 1974: Prices jumped 140% to ₹506/10g due to global inflation.
- 2011: Prices soared to ₹26,400 after the 2008 crisis made people want gold more.
- 2020: Lockdowns led to a 38% price increase to ₹48,651 compared to 2019.
Decade-by-Decade Analysis of Gold Price Trends
| Decade | Start Price (₹/10g) | End Price (₹/10g) | Key Drivers |
|---|---|---|---|
| 1960s | 1964: 63.25 | 1970: 184 | Inflation, industrial demand |
| 1970s | 1971: 193 | 1980: 1,330 | Global crises, oil shocks |
| 1980s | 1980: 1,330 | 1990: 3,200 | Liberalization policies |
| 2000s | 2000: 4,400 | 2009: 14,500 | Urbanization, rising incomes |
| 2010-2025 | 2010: 18,500 | 2025: 79,200 | Pandemic, currency fluctuations |
Learning from Past Gold Price Volatility
Looking at past gold price analysis, we see prices jump during tough times. For example, the 1991 reforms led to a 13% price increase. In 2020, prices hit ₹48,651 due to panic buying. These examples show that uncertainty makes people want gold more.
Since 2001, gold prices have gone up by 15% each year on average. By studying historical gold price data, we can figure out the best times to buy or sell. Gold often does well when the world is unstable, acting as a shield against inflation.
Global Factors Influencing Gold Price Fluctuations in India
Global economic trends affect gold prices in India, whether for weddings or investments. Global economic impact on gold prices is linked to the US dollar’s strength. When the dollar goes up, gold prices often drop because it costs more in rupees.


- Geopolitical tensions (e.g., Ukraine war) driving demand for safe-haven assets
- US Federal Reserve interest rate hikes reducing gold’s appeal compared to bonds
- Inflation spikes worldwide pushing investors toward gold as a hedge
| Factor | Impact | Example |
|---|---|---|
| US Dollar Strength | Inversely affects rupee-priced gold | Rupee depreciation in 2022 caused 10% price jumps |
| Geopolitical Crises | Rises demand for gold as a safe asset | Russia-Ukraine conflict boosted global gold reserves by 5% |
| Inflation Rates | Directly correlates with gold’s value | 2021 global inflation saw gold hit $2,000/oz |
Over 60% of India’s gold demand comes from rural areas. So, global supply chain delays, like during the pandemic, can raise local prices. Keep an eye on Federal Reserve decisions and currency changes. By watching these, you can buy gold when prices are low due to dollar weakness or peace in the world.
Understanding India-Specific Gold Price Determinants
India’s gold market trends are influenced by unique factors. These go beyond global benchmarks. Seasonal demand, government policies, and regional dynamics all play key roles in setting local prices. Let’s explore these factors to help you make smarter choices in the market.
- Seasonal Demand: Festivals like Diwali and wedding seasons increase demand, raising prices. Over 2,000 tons of gold are traded during these times.
- Government Policies: Taxes like GST and import duties affect final costs. Changes in sovereign gold bond schemes or RBI reserve decisions also impact supply and pricing.
- Local Market Realities: Making charges, regional transport costs, and purity preferences (like 22K vs. 24K) cause price differences between cities like Delhi and Ahmedabad.
Inflation and the rupee-dollar exchange rate also influence prices. When the rupee weakens, imported gold becomes more expensive. On the other hand, RBI efforts to stabilize the currency can either raise or lower gold prices. Always check state-specific taxes and jeweler margins to compare local rates.
Knowing these factors helps you buy during off-peak seasons or take advantage of policy changes. Keep an eye on how India-specific trends interact with global ones for better investment results.
The Relationship Between the Indian Rupee and Gold Prices
When the Indian rupee weakens against the US dollar, gold prices go up for buyers. Gold is traded worldwide in USD. So, when the rupee falls, you need more rupees to buy the same gold. This makes gold more expensive locally, even if prices globally don’t change. Gold price analysis often points out this link.
“Gold prices in India are influenced by global economic conditions, currency strength, and domestic demand.”
Here’s how it works: three key factors affecting gold prices are at play:
- Exchange rate shifts: A weaker rupee increases import costs.
- RBI’s forex strategies: Reserve Bank of India’s currency interventions can stabilize or destabilize prices.
- Global USD trends: A stronger dollar pushes up gold’s USD price, compounding local inflation.
Currency Depreciation and Its Impact on Gold Valuation
In 2025, when the rupee fell to ₹85/$1, gold prices hit record highs. This shows how currency moves directly impact your local costs. A weaker rupee makes imports costlier, squeezing retailers who pass costs to consumers.
Foreign Exchange Reserves and Gold Price Correlation
RBI holds gold in reserves to manage forex stability. If they sell gold to balance currency flows, it can temporarily lower global prices. But long-term, gold price analysis shows that India’s forex reserves and rupee health remain critical indicators for investors.
Track the rupee-dollar rate daily. Apps like the Bajaj Finserv App help monitor these trends to time your purchases during favorable exchange rates.
How Inflation Affects Your Gold Investments in India
When prices go up, your money doesn’t go as far. But gold can help keep your savings safe. Inflation is a big factor in gold prices. It makes people turn to gold when the rupee’s value drops.
India’s Consumer Price Index (CPI) is usually between 4% and 6% each year. This shows how inflation affects what people choose to invest in.
In 2020, gold prices soared to ₹56,191 per 10g because of the pandemic and inflation. Over 40 years, gold has beaten inflation by 3% each year. This makes gold a solid choice to keep your wealth safe when times are tough.
When inflation goes up, people want more gold. This drives gold prices up to keep pace with the rising costs.
There are many ways to use gold to fight inflation. You can buy physical gold, ETFs, or Sovereign Gold Bonds. These options help protect your money from rising costs.
For example, ETFs make it easy to invest in gold without having to store it. Gold’s value often goes up when stocks fall because of inflation.
It’s smart to watch inflation closely and adjust your investments. If gold prices go up, you might be able to borrow more against it. But if prices drop, you might have to borrow less. Always keep a 25-30% buffer to avoid sudden changes in your loan terms.
Keeping an eye on gold prices and inflation is key. Use metrics like CPI to guide your investments. Diversify with gold to manage risks. Remember, inflation is a sign to strengthen your portfolio with gold.
Gold Price Chart Patterns: What They Reveal About the Indian Market
Learning about gold price chart patterns can uncover secrets in India’s gold market. Beginners should start by watching trends on daily or weekly charts. A rising line with higher highs shows a positive trend. A flat line means a pause.
Tools like 50-day and 200-day moving averages help find long-term trends.
- Support/resistance levels show key price points where buying or selling changes.
- Head-and-shoulders patterns signal trend changes—like in 2023 when prices hit ₹65,330 before falling.
- Double tops or bottoms confirm reversals after touching similar price levels twice.
Advanced gold price analysis uses Fibonacci retracement levels. Prices retracing 38% or 61% of a move often signals a change. For example, the ₹64,070 price in 2024 was a double bottom after 2023’s high, showing a buying chance.
Volume spikes confirm patterns. High volume during a breakout shows a strong trend. Combine this with factors like rupee strength or festival demand. Setting alerts at key chart levels helps you act fast when patterns form.
Using technical signals with gold price chart patterns improves timing. Watch patterns daily to find entry points during dips or exit before peaks.
The Import Duty Factor: How Taxes Shape Gold Prices
Import duties and taxes play a big role in factors affecting gold prices in India. When the government changes these taxes, it affects what you pay for gold. For example, 10g of 24k gold now costs ₹52,785, with taxes making up to 30% of that.
India’s tax policies change often. In 2013, a 10% import duty hike made prices jump 15%. Today, GST adds 3%, and import duties range from 1-12% based on purity. These taxes make local prices different from global ones.
- Import duties add ₹2,000–3,000 to 10g gold
- State taxes and GST add another 5–7% markup
- Policy changes can trigger price swings of 5–10% overnight
Keep an eye on government announcements. Budget changes or trade agreements can change gold market trends. For example, when India lowered import duties in 2023, prices fell 4%. Watch how taxes and global rates interact to find good deals.
Look at prices in different cities. Mumbai’s 24k gold is ₹7,594/gram, while Kolkata’s is ₹7,749. These differences show how taxes vary by region. Knowing these factors affecting gold prices helps you save money, especially during festivals or weddings.
Gold Price Volatility: Managing Risk in Your Investment Portfolio
Gold prices in India have seen big swings, rising 6.5% in 2023 and reaching Rs 74,000 per 10 grams in 2024. To keep your investments safe, it’s key to know how to handle these ups and downs.
Measuring Gold Price Volatility in the Indian Context
Use tools like standard deviation and average true range (ATR) to track gold price fluctuations. These metrics show how much prices change over time. For example, prices jumped 18% from February to April in 2024, showing the importance of staying updated.
Strategies to Minimize Risk During Price Fluctuations
- Adopt rupee-cost averaging: Buy fixed amounts monthly to smooth out purchase costs
- Stagger purchases during dips of 4-5%, as advised by experts
- Allocate 5-10% of your portfolio to gold, per financial advisors
- Consider sovereign gold bonds (SGBs) for tax efficiency and fixed returns
When Volatility Can Work in Your Favor
Sharp gold price volatility can open up good buying chances. In 2024, prices went up Rs 12,000 in just two months, helping those who acted quickly. Keep an eye on trends to spot the best times to buy during market drops. Gold has a 12% CAGR over 25 years, beating short-term losses.
But remember, gold doesn’t earn interest, so it shouldn’t be more than 10% of your total assets. Mix it with other investments to balance risk and reward.
Digital Gold vs. Physical Gold: Price Variation Factors
When picking between digital and physical gold, price is key. Both show gold market trends, but their costs differ. Physical gold has making charges and purity levels, like the ₹475 difference per 10g between 22k and 24k gold. Digital platforms avoid storage costs but have management fees.
- Physical gold prices vary by city: Delhi’s 24k gold costs ₹7,726/gram vs. ₹7,548 in Ahmedabad.
- Digital gold tracks spot prices but may lag during gold price fluctuations, like the 1.00% rise seen on Mar 10, 2025.
- Taxes differ too—sovereign gold bonds offer tax-free interest, while physical sales face 3% GST.
Storage costs also play a role. Physical buyers pay for safety deposit boxes, while digital options charge annual fees (0.5%–1.5%). Digital gold often has lower premiums but less flexibility. For example, selling 10g of digital gold might give 99% of spot rates, while physical resale could lose 2% to brokers.
Remember, regional gold market trends affect physical prices. Investors with ₹1 lakh might prefer digital for ease, while large purchases over ₹5 lakh often favor physical for diversification. Always check real-time rates to track gold price fluctuations and choose based on your liquidity needs.
Gold Price Analysis Tools and Resources for Indian Investors
Use tools to track gold prices in real-time, tailored for India’s market. Apps like Moneycontrol or Bloomberg provide live rates and historical trends. They also show purity levels specific to cities.
These platforms let you compare prices in India with global standards. For example, the London Bullion Market Association (LBMA) rates hit $2,938/ounce early in 2025.
- Follow RBI’s official site for reserve updates—India’s gold holdings rose to 879 tonnes in 2025.
- Use GoldPrice.org for global trends impacting domestic rates.
- Monitor SEBI-registered platforms like Upstox for customized alerts.
“Gold price forecasting requires blending technical charts with RBI policy updates,” says a senior analyst at Bajaj Financial Securities.
Set price alerts on apps like ETMONEY to catch drops or spikes. Also, check gold ETF data—January 2025 saw $435M inflows—showing investor sentiment. Always cross-check forecasts with Google Trends for demand patterns during festivals like Dhanteras.
Build a toolkit by combining these resources. Check Investing.com for technical analysis tools and RBI’s monthly reports. Stay ahead of imports and currency swings that drive price changes.
Festival Season and Wedding Demand: Cyclical Gold Price Trends
India’s gold market trends are influenced by festivals like Diwali and weddings. During Akshaya Tritiya and Dhanteras, demand increases, causing prices to rise. For instance, Diwali 2023 led to record gold prices, prompting buyers to opt for lighter designs. These trends recur annually, providing insights for gold price forecasting.
- Diwali & Dhanteras: Prices tend to go up 5-8% before these festivals. In 2023, Diwali saw a significant spike despite a 9% drop in Q4 demand.
- Wedding Seasons: High demand is seen in January-February and October-November. In 2024, only 16 auspicious days are scheduled for Q1, down from 28 in 2023.
- Akshaya Tritiya: Demand surges 15-20% as buyers flock to purchase gold during this period.
Keep an eye on these dates for the best time to buy. For example, gold prices often drop after festivals. Use apps like CMIE or LiveMint to track these changes. Historical data shows prices peak in Q1 and Q4, aligning with major festivals. In 2023, despite lower Q4 demand, festive buying remained strong, showing the value of waiting for better rates.
Looking ahead to 2024, gold price forecasting suggests caution due to fewer wedding dates. However, watch for regional variations. With India’s GDP growth at 7.8%, economic confidence might boost demand. Combine this with global trends, like China’s 10% rise in jewelry sales, to understand the interplay of local and global factors. Stay ahead by monitoring both cultural calendars and economic reports for your next gold purchase.
International Economic Indicators That Impact Indian Gold Prices
Global economic changes affect India’s gold markets every day. As the world’s second-largest gold importer, your choices are linked to global trends. Keep an eye on these three key factors to better predict gold price forecasting:
- US Dollar Movements: A stronger dollar makes gold more expensive for rupee buyers. In 2020, the dollar’s rise during the pandemic pushed global prices over $2,000/ounce.
- Global Crises: Events like the 2008 financial crash or the Russia-Ukraine war increase gold’s “safe-haven” demand, raising prices. During 2008, prices jumped 25% in a year.
- Central Bank Policies: Rate hikes by the US Federal Reserve or the ECB directly affect gold’s appeal. Lower rates in 2020 made gold more valuable by 28% that year.
Watch for policies from the Bank of Japan or IMF warnings to spot trends early. Tools like the World Bank’s dashboard or Bloomberg help track these signals. For example, a 6.7% current account deficit in 2012 led India to raise import taxes, showing how global and local factors meet.
Combine this data with inflation trends and geopolitical news. When crises hit, investors worldwide turn to gold, pushing prices up—even in India. Staying updated on these trends helps you anticipate changes and improve your gold price forecasting strategy.
How to Forecast Gold Price Movements in the Indian Context
To forecast gold prices, you need to mix global trends with local insights. Start by watching inflation rates and currency changes, as they affect prices. Also, keep an eye on seasonal demand, especially during festivals and weddings.
Here’s how to create your forecast model:
- Keep an eye on monthly inflation data from the Reserve Bank of India.
- Watch USD-INR exchange rates on platforms like XE.com.
- Use ARIMA models to analyze past price trends. These models are effective, even with big price swings.
| Factor | Impact |
|---|---|
| Inflation | Directly correlates with rising gold demand |
| Monsoon season | Low demand periods create buying opportunities |
| Central bank policies | Interest rate cuts typically boost gold purchases |
Studies show the ARIMA (0,1,1) model is very accurate, with an R² of 0.99. Use metrics like MAPE (under 10%) to check your predictions. Also, watch for big world events, like the 2008 crisis when gold prices went up 6%.
To stay ahead, do the following:
- Review quarterly RBI inflation reports
- Subscribe to free tools like World Gold Council’s market updates
- Update forecasts after major policy changes
Even with advanced models like ARIMA, there’s always some uncertainty. Use statistical tools and real-time gold price analysis to make smart choices.
Practical Tips for Buying Gold During Price Fluctuations
Buying gold at the right time can make you profit from gold price fluctuations. Learn to track gold market trends and use them to your advantage.
Best Times to Buy Gold in India
Prices often go down in early January or after Diwali. Look for deals in gold market trends during slow months like February or March.
- Buy gold after festivals when prices fall 2-5%.
- Watch RBI’s interest rate changes in April and October for buying chances.
Red Flags for Price Drops
Look out for these signs of a price drop:
“A weakening rupee against the dollar can trigger gold price volatility.”
- Falling crude oil prices (reduces import costs, lowers domestic rates)
- Global central banks raising interest rates (reduces gold’s appeal vs. bonds)
- US dollar index weakening (makes dollar-priced gold cheaper in rupees)
Create Your Buying Strategy
Make a plan using this framework:
| Factor | Consider | Example |
|---|---|---|
| Timing | Track monthly price charts | Buy in March before Akshaya Tritiya rush |
| Budget | Divide purchases into quarterly installments | Use Bajaj Finance’s flexible loans for bulk buys |
| Risk | Track inflation rates monthly | Allocate 10-15% of savings to gold during high inflation |
Keep an eye on global events like currency wars or trade disputes. Mix physical gold with digital ETFs to diversify your portfolio.
Conclusion: Navigating the Dynamic Gold Market with Confidence
Understanding gold price fluctuations helps you make better choices. Many factors, like cultural traditions and global economic changes, influence gold market trends. Over the last decade, gold prices have gone up by 150%.
This rise is due to inflation, changes in currency value, and increased demand during special events. These events can include festivals or weddings.
Buying gold successfully isn’t just guessing. Keep an eye on past trends and look for seasonal lows. Also, watch for big global events like changes in currency value or political shifts.
Tools like price charts and real-time alerts can help you find good deals. It’s important to have a plan that fits your risk level and goals. This could be saving for a wedding or building long-term wealth.
Gold prices have gone up since 2016, showing its value as a safe investment. But, high prices might make people choose digital gold instead of traditional jewelry. Keep up with news from trusted sources like the World Gold Council or Reserve Bank of India.
Adjust your strategy as the market changes. This way, you can balance old traditions with new insights.
Being confident means understanding the market’s patterns. Whether you’re saving for a big event or spreading out your investments, making smart choices can turn ups and downs into chances. By mixing cultural knowledge with data-driven plans, you can move through India’s gold market with confidence and purpose.


